NetAn

Support and Development by
- Maribel Hernández Rosales Laboratory of Bioinformatics and Complex Networks, Center for Research and Advanced Studies (CINVESTAV), Irapuato Unit
- Marcos González Laffitte Instituto de Matemáticas, Universidad Nacional Autónoma de México, Mexico
- Valerie De Anda University of Texas at Austin. Marine Science Institute
Network Analyzer NetAn is built on broadly used python libraries that are freely available, such as Networkx. The main script NetworkAnalysis.py receives a list of interactions weighted or unweighted (-d and –u options, respectively) and computes several metrics.
We focused on identifying key features that are showed to be significant in comparison with those in random networks. Therefore, NetAn computes properties of the directed networks such as density, hubs with maximum in-degree and out-degree and clustering coefficient, among others. NetAn also assumes the networks as non-directed and calculated further topological features such as modularity and communities using the Louvain method (Blondel et al., 2008).
Given that the real networks are very dense in terms of connections, we implemented in NetAn a method to generate random networks that resemble the real ones using the option gnm_random_graph from Networkx python module. A hundred random networks were generated for each real one, with the same number of nodes and edges. Then, for each one same topological features were extracted and the average compared to those of real networks.
Network Anazyler NetAn, helps facilitate the overal analysis of complext networks by computing several topologic statistics and visualization plots.
Currently NetAn uses the output derived from Metamis sofware sofware, which is a directed network , and compute several statistics
Please note that any networked from another software can also be used ie WGCNA: Weighted Correlation Network Analysis, MENA:Molecular Ecological Network Analyses. Please note that your input file must have(.txt) extention
## Installation
### Using Conda Install conda or miniconda depending of your needs.
Once conda is installed activate conda and use the yml file provided with netan.
conda activate
conda env create -f netan_conda_env_osx-64.yml
conda activate netan_env
You are ready to use netan with all the dependencies.
If you don’t want to use conda, the following dependencies must be installed first.
sudo -H pip install python-louvain
Some extra python libreries
Numpy and matplotlib
sudo pip2 install numpy matplotlib
Librarpy tk
sudo apt-get install python-tk
Running NetAn
python Networks/scripts/NetworkAnalysis.py -d Networks/data/a_phylum_consensus.txt
In case of having undirected networks , you can use the -u option
python Networks/scripts/NetworkAnalysis.py -u Networks/data/a_phylum_consensus.txt
Example of directed network
Separated by tab
Firmicutes      Ascomycota      -0.000272753971115013
Firmicutes      Chlorobi        -0.000242343947634859
Firmicutes      Ignavibacteriae 0.000178797125901064
Firmicutes      Dikarya unclassified    -0.00017738367107812
Firmicutes      Candidatus Beckwithbacteria     -0.000173505314274337
Firmicutes      Candidatus Woesebacteria        -0.00015914042503068
Firmicutes      Bacteroidetes/Chlorobi group unclassified       -0.000153790507711771
Firmicutes      Armatimonadetes 0.000145294003838928
Firmicutes      Cloacimonetes   -0.000130612871481698
Firmicutes      Candidatus Shapirobacteria      -0.00013061259484347
Example of undirected network
Separated by tab
Firmicutes	Actinobacteria
Ascomycota	Nitrospinae
Firmicutes	Candidatus Magasanikbacteria
Ascomycota	Candidatus Pacebacteria
Actinobacteria	Candidate division CPR2
Bacteria unclassified	Dikarya unclassified
Actinobacteria	Thermotogae
Bacteria unclassified	Ignavibacteriae
Bacteria unclassified	Candidatus Beckwithbacteria
Actinobacteria	Patescibacteria group unclassified
The main script : NetworkAnalysis.py recieves the above mentioned files and compute several topological features such as density, mean degree, hubs, connected components, clustering coefficient modularity etc.
Analyzing the output
Once the program has finished, the following message will appears in the terminal
Analysing Network:    Networks/data/a_phylum_consensus.txt    type:   Directed
        - Parsing file to network ...
        - Obtaining order ...
        - Obtaining size ...
        - Obtaining diameter (for undir network version) ...
        - Obtaining radius (for undir network version) ...
        - Obtaining density ...
        - Obtaining mean degree ...
        - Obtaining max degree ...
        - Obtaining mean clusttering coefficient ...
        - Obtaining hubs ...
        - Obtaining mincut vertex set (for undir network version) ...
        - Obtaining mincut edge set (for undir network version) ...
        - Obtaining connected components ...
        - Obtaining strongly connected components (just for directed case) ...
        - Obtaining maximal cliques (for undir network version) ...
        - Obtaining cycle basis (for undir network version) ,,,
        - Obtaining maximal independent set ...
        - Obtaining degree distribution ...
        - Drawing in degree distribution ...
        - Drawing out degree distribution ...
        - Obtaining communities (for undir network version)...
        - Drawing networks ...
        - Running Random Network Analysis ...
        - Finished analysis for this network
If you did not have any problems with the dependencies, the following output files should have been generated
a_phylum_consensus_directed.txt
a_phylum_consensus_random_results.txt
a_phylum_consensus_distribution_indegree.png
a_phylum_consensus_distribution_outdegree.png
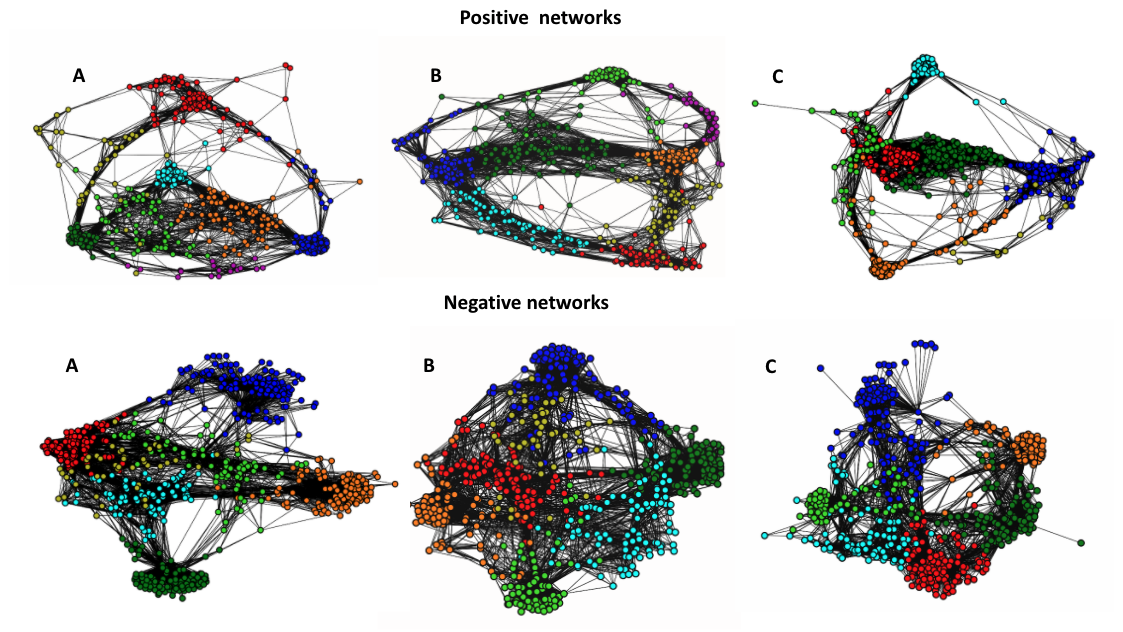
a_phylum_consensus_community_network.png
a_phylum_consensus_directed_network.png
The files containing the statistical analysis are the folowing:
cat a_phylum_consensus_directed.txt
Order:61
Size:3560
Diameter (Undirected):1
Radius (Undirected):1
Density:0.972677595628
Mean Degree:58
Max Possible Degree:60
Clustering Coefficient:0.5
Max Degree Hubs:
- Max In Degree: 60
- Number of Hubs with Max In Degree: 1
- Hubs with Max In Degree: Ignavibacteriae
- Max Out Degree: 60
- Number of Hubs with Max Out Degree: 50
- Hubs with Max Out Degree: Verrucomicrobia,Bacteroidetes,Parcubacteria group unclassified,Archaea unclassified,FCB group unclassified,Candidatus Kaiserbacteria,Ascomycota,Chlorobi,Actinobacteria,Marinimicrobia,Terrabacteria group unclassified,Patescibacteria group unclassified,Candidatus Peregrinibacteria,Armatimonadetes,Eukaryota unclassified,Bacteria unclassified,Dikarya unclassified,Bacteroidetes/Chlorobi group unclassified,Candidatus Magasanikbacteria,Candidatus Rokubacteria,Cloacimonetes,Nitrospinae,Candidate division CPR2,Firmicutes,Deinococcus-Thermus,Proteobacteria,Candidatus Gottesmanbacteria,Spirochaetes,Candidatus Woesebacteria,Candidatus Poribacteria,Nitrospirae,Candidatus Aminicenantes,Chloroflexi,Planctomycetes,PVC group unclassified,Candidatus Uhrbacteria,Fusobacteria,Candidatus Beckwithbacteria,Synergistetes,Unclassified Bacteria unclassified,Gemmatimonadetes,Chlamydiae,Nanoarchaeota,Cyanobacteria,Microgenomates group unclassified,Bacteria candidate phyla unclassified,Thermotogae,Acidobacteria,Thaumarchaeota,Euryarchaeota
The same statistics but in 1000 random networks with the same number of nodes and edges.
cat a_phylum_consensus_random_results.txt
Random Analysis Results, Mean Measures:                 runs(100)
 - [/] order:   61
 - [/] size:    3560
 - [u] diameter:        1.79
 - [u] radius:  1.0
 - [d] density: 0.972677595628
 - [d] mean degree:     58.0
 - [d] clustering coefficient:  0.499653314753
 - [d] maximum in degree:       60.0
 - [d] maximum out degree:      60.0
 - [d] hubs with max in degree: 11.4
 - [d] hubs with max out degree:        11.41
 - [u] modularity:      0.0
 - [u] number of communities:   1.0
 - [/] number of connected components:  1.0
 - [d] number of strongly connected components: 1.0
 - [u] number of cycles in cycle basis: 1768.73

[u] undirected associated graph
[d] directed graph
[/] both undirected and directed
Example of output networks using communities
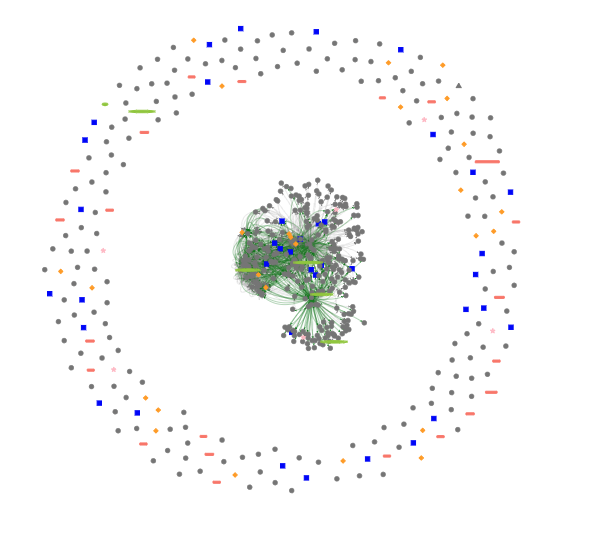
Example of interactive network using R
We recomend to use visNetwork. We provide a simple data test containing the nodes and the edges and the R script to obtain the following interactive graph
Propierties
- Order: Number of nodes
- Size: Number of edges
- Density: Describes the portion of the potential connections in a network that are actual connections
- Modularity: Measure the strength of division of a network into modules (also called groups, clusters or communities), re defined as groups of densely interconnected nodes that are only sparsely connected with the rest of the network
- Node degree: Is the number of connections or edges the node has to other nodes.
- Connectivity: The minimum number of elements (nodes or edges) that need to be removed to disconnect the remaining nodes from each other
- Average_degree_centrality: Is defined as the number of links incident upon a node
- Average_closenss_centrality: The more central a node is the lower its total distance from all other nodes
- Average_betweenness_centrality: Quantifies the number of times a node acts as a bridge along the shortest path between two other nodes
- Average_number_of_cliques_with_order: Is a subset of the vertices, c ⊆ v, such that every two distinct vertices are adjacen
- Maximum_independent_sets_with_order: Is a set of vertices in a graph, no two of which are adjacen
Cite
If you find this software usefull please cite us as: